Every month, Fynease briefs
your management team.

Not with AI opinions. With accounting evidence. Every finding is ranked. Every number traces back to the ledger. Every quantified action discloses its assumptions. Included in every Fynease plan.

4–7x
Return on subscription
Based on recovered capacity at $150/hr billing rate
18–30 hrs
Recovered per month for a practice with 6 clients
Eliminated entirely from your monthly workflow
Included
In every Fynease plan — no separate Intelligence tier
Valuation add-on available at $249/client for QoE and exit readiness
The concept

Deterministic Intelligence.

Every insight is generated from accounting evidence. Every bridge reconciles. Every quantified action discloses its assumptions. Every number can be traced back to the ledger.

Most finance software generates opinions and calls them insights. Fynease generates evidence and lets you draw the conclusion.

That is the difference between a CFO who says "revenue fell" and one who says "revenue fell because of $127K in churn from three customers, with 93% of next quarter already contracted." The second CFO is using Fynease.

Assembled from ranked findings
Five findings ranked by impact. The biggest story leads — not an alphabetical list of KPIs.
Every number from the ledger
Not estimates, not AI summaries. Every figure traces to the schedules, the adjusted trial balance, or a saved forecast version.
Bridges that tie by construction
EBITDA bridges, revenue bridges, cash bridges — every one reconciles to zero variance. If it doesn't tie, it doesn't appear.
Assumptions disclosed
Sensitivity levers show their basis on hover. Benchmark bands disclose their vintage and source. No black boxes.
The management briefing

Five lanes. Four questions.
Every month.

Fynease applies the same reasoning framework to every operating lane. What happened, why it happened, what happens next, and what to do about it. That consistency trains management to reason through financial performance the same way a strong CFO would.

📈
Revenue
What we earned, why it moved, where it's heading, what to pull.
1
What happened?
Did revenue grow — and is it good revenue? Quality of Revenue score, AR quality signal, growth vs industry benchmark band.
2
Why did it happen?
New, expansion, price, or churn? Revenue bridge decomposed by component. Churn identified. Price-volume-mix at item level.
3
What happens next?
How much is already contracted? Deferred revenue schedules show committed revenue 3 months forward. Modeled revenue fills the rest.
4
What can we pull this month?
Ranked action signals — lost vs won revenue, concentration risk, collection urgency from AR aging overlay.
Gross Margin
The quiet leak.
1
Where does margin sit?
Gross profit vs prior year and budget. Per-customer margin where costs are dimensioned. Rate vs mix decomposition.
2
Rates, or mix?
GM bridge with rate-on-retained and price-vs-cost drill. Whether margin is falling because costs rose or because the revenue mix shifted.
3
Where does it drift?
Forecast margin over the next quarter, re-snapshotted automatically when the forecast updates.
4
What closes the gap?
Pricing levers, cost tagging gaps, customer-level margin improvement opportunities from dimension data.
Operating Expenses
Where the growth got spent.
1
How much, and is it leveraged?
OpEx vs prior year. Whether expenses grew faster or slower than revenue. Statistical anomaly detection flags unusual movements.
2
What grew?
Top movers vs prior year by CoA group — contractors, salaries, travel, marketing — ranked by EBITDA impact.
3
What's committed?
Forecast OpEx over the next quarter. Loan, lease, and payroll obligations already scheduled.
4
What can we trim?
Ranked cost reduction signals — vendor spend, headcount leverage, unusual variance items flagged for attention.
EBITDA
The scorecard that ties it together.
1
What did the month earn?
EBITDA total, variance vs prior year and budget. Industry benchmark band — where this result sits against comparable businesses.
2
Revenue, margin, or spend?
EBITDA bridge decomposed into revenue, margin, and OpEx contributions. Ties to the other lanes by construction — no rounding variance.
3
Where does it land?
12-month EBITDA trajectory from the working forecast. Margin as a percentage of revenue — not just a dollar figure.
4
What do the levers add up to?
Quantified action signals across revenue, margin, and cost — summed into a total recoverable EBITDA impact for the month.
$
Cash & Runway
The number the founder loses sleep over.
1
How much runway is left?
Cash and runway based on gross burn — 3-month average. DSO vs industry benchmark. All from synced GL data, not manual entry.
2
Operations, or working capital?
Cash bridge: operating result, AR movement, AP movement, debt and equity. Shows exactly where cash went — not just that it left.
3
Any squeeze ahead?
13-week cash flow forecast at weekly grain. Loan and lease payments already scheduled. AR aging overlays with collection timing. Forecast low point shown with date and amount.
4
How do we buy back cash?
Sensitivity levers with quantified one-time impact — extend supplier terms, accelerate collections. Each lever discloses its assumption.

Deterministic briefing — every figure from the ledger, the schedules, or a saved forecast version. Benchmark bands are a curated pack, not live market data. Always labeled.

Not a mockup.
This is the actual output.

Every figure below traces to the ledger, the schedules, or a saved forecast version. Benchmark bands disclose their vintage. Sensitivity levers disclose their basis. Nothing is generated by a language model.

01 · Executive briefing and market context
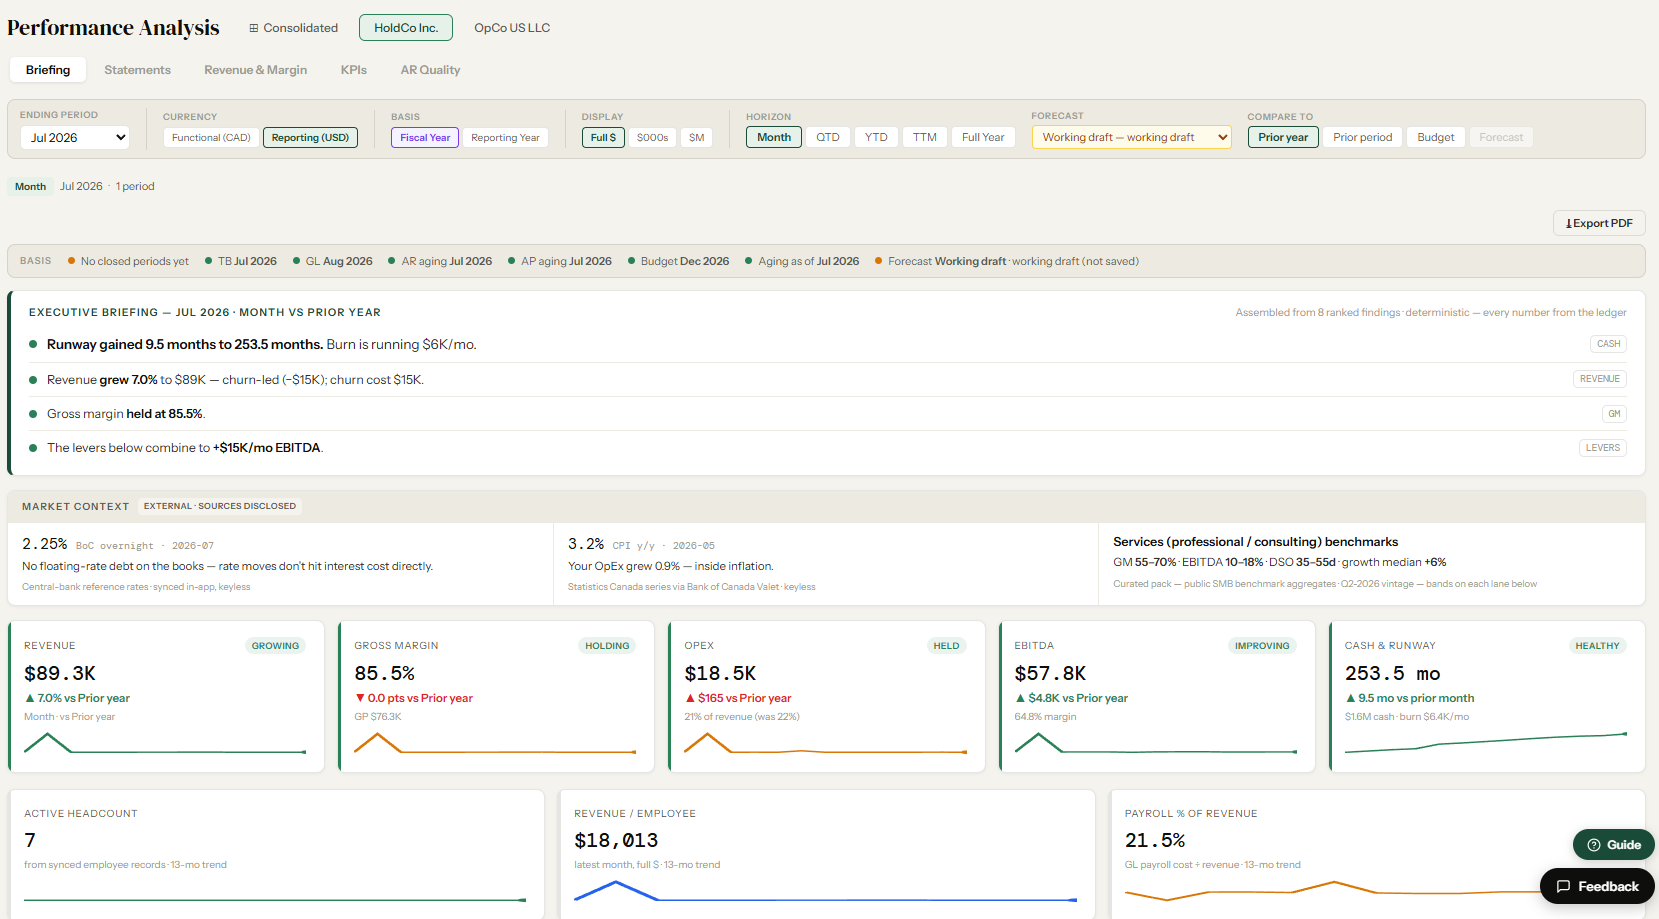
Executive briefing with eight ranked findings, Bank of Canada rate, CPI, industry benchmark bands, and KPI cards across revenue, gross margin, OpEx, EBITDA, and cash runway

Ranked findings lead with the biggest story. Market context pulls central bank rates and CPI keyless. Headcount, revenue per employee, and payroll as a percentage of revenue sit alongside the financial lanes.

02 · Revenue, Gross Margin, Operating Expenses
Revenue, Gross Margin, and Operating Expenses lanes each showing what happened, why it happened, what's next, and how to make it happen

Revenue decomposed into new logos, expansion, contraction, churn, and FX. Contracted versus modeled revenue for the next three months. Statistical anomaly detection on OpEx. Quantified sensitivity levers with disclosed assumptions.

03 · EBITDA and Cash & Runway
EBITDA and Cash and Runway lanes showing bridge decomposition, forecast low point from the 13-week cash engine, committed obligations, and scenario comparison

EBITDA bridge ties to the revenue and margin lanes by construction. Cash bridge separates operating result from working capital movement. The 13-week engine surfaces the forecast low point with its date. Committed obligations are already scheduled.

Everything behind the briefing.

The briefing surfaces the most important findings. Behind it is the full analytical layer — available for drill-down, client presentations, and board packs.

📉

Variance analysis

Actual vs. budget vs. prior period across every line. Driver-level explanation of what changed and why — volume, price, mix, one-time items. Formatted for executive presentation, not just accounting review.

📊

Price-volume-mix analysis

Decompose revenue and margin movement into price, volume, and mix components across products, customers, and business segments. The analysis that separates real performance from noise.

📈

Revenue and gross margin attribution by customer

See exactly where revenue and gross margin are coming from — by customer, segment, and product line. Every number traces back to the close data Automate produced.

🗂️

Segment, customer, and product profitability reporting

Define any reporting dimension — customer group, product line, geographic segment, or business unit. Fynease allocates revenue and costs and produces contribution margin by segment every close.

Quality of revenue

Classify revenue as recurring, non-recurring, one-time, or project-based. Cohort analysis, customer concentration, churn indicators, and revenue predictability scoring — the analysis any investor or acquirer will ask for first.

🧾

AR quality analysis and scoring

Analyze accounts receivable aging by customer, assess collection risk, and score AR quality across your portfolio. Identify concentration risk and flag receivables that need attention before they affect cash position. Understand the true collectability of what's on the Balance Sheet.

⚖️

Breakeven analysis

Fixed vs. variable cost decomposition, contribution margin by product and segment, breakeven revenue calculation. Margin sensitivity to volume and price changes — essential for pricing and growth decisions.

🎯

KPI engine

Track burn rate, runway, DSCR, gross margin, customer acquisition cost, lifetime value, and any custom metric relevant to your client's business. Actual vs. target with trend visualization.

🔭

Forecasting

12 to 24 month driver-based projections with base, upside, and downside scenarios. Sensitivity analysis across key assumptions. Forecast vs. actual tracking with automatic refresh each close cycle.

🏷️

Transaction-readiness signals

Revenue quality scoring, EBITDA trend analysis, working capital behaviour, customer concentration, and one-time item flags — surfaced continuously as part of monthly reporting. These are the early signals that tell you whether a client is ready for a process. Formal quality of earnings, EBITDA normalization, DCF, and the working capital peg live in the Valuation module.

📋

Board and investor pack composer

Assemble monthly or quarterly board packs from your Intelligence outputs — financial highlights, KPI dashboard, variance commentary, forecast update, and key decisions required. Consistent format across every client, every period.

Built for fractional CFOs

The tool your practice
has been missing.

Intelligence is designed specifically for the fractional CFO model — multiple clients, limited time, and a need to deliver consistent, high-quality analysis without rebuilding everything from scratch each month.

Valuation activates per client

Every Fynease plan includes variance analysis, forecasting, board packs, KPIs, and revenue attribution for all clients. The Valuation add-on ($249/client/month) activates per client for clients in a sale process, investor raise, or requiring quality of earnings reporting. Add it when a client needs it, remove it when they don't. Your bill reflects exactly what each engagement requires.

Your clients' data belongs to your clients. Not to us, not to anyone else.

Client data is strictly isolated at the database level — no cross-client access, no benchmarking that exposes individual client data, no access by any third party. Encrypted at rest and in transit. Full details on our Security page.

The same framework across every client

Every client gets the same briefing structure, the same bridge methodology, and the same level of rigour — regardless of industry or complexity. Your judgment and your commentary, with Fynease handling the assembly and calculation work underneath.

The ROI for a fractional CFO practice

A fractional CFO managing eight clients at an average of four hours per client per month on reporting spends 32 hours monthly on work that Intelligence largely automates. At a billing rate of $150 per hour, that's $4,800 of recovered capacity per month.

A Scale plan covering ten clients is $999/month early bird — and includes the full close layer as well as Intelligence. Against roughly $4,800 of recovered capacity, the return is approximately 5x before accounting for output quality or the additional clients you can serve with the time back.

A practitioner with 12 clients recovers a full week of capacity every month.

Getting started

Intelligence is included for every client within your plan — there is no separate Intelligence tier to activate. Start with Automate to establish a clean, controlled close. Once the close data is reliable, Intelligence uses it to brief management, update forecasts, and produce reporting from the same reconciled numbers.

Included in all plans. Valuation available as an add-on.

Every Fynease plan includes the full Intelligence feature set — variance analysis, forecasting, KPIs, board packs, and revenue attribution. The Valuation add-on activates per client for QoE and exit readiness work.

✓ Included in all plans
Variance analysis · Forecasting · KPIs · Board packs · Revenue attribution
from $249/mo standard
from $199/mo early bird
Valuation add-on
Quality of earnings · Exit readiness · Investor reporting · Per client
$299/client/mo standard
$249/client/mo early bird

Free 14-day trial · No credit card required

Start free trial See full pricing

Questions about the briefing

Answers on deterministic analysis, what the briefing covers, and how it differs from AI-generated commentary.

What is a management briefing in Fynease?
A structured monthly document covering five operating lanes — revenue, gross margin, operating expenses, EBITDA, and cash and runway. Each lane answers the same four questions: what happened, why it happened, what happens next, and what management can do about it. It is produced automatically once the close locks, from the same reconciled data.
Does Fynease use AI to write financial commentary?
No. All analysis is deterministic. Every figure derives from the ledger, the schedules, or a saved forecast version, and every bridge reconciles to zero variance by construction. Running the same period twice produces identical output. Pattern matching is used only to surface candidate transactions for human review — never to compute or assert a figure.
What does deterministic mean in financial reporting?
It means findings are calculated from source records using fixed, reproducible logic rather than generated by a language model. The practical tests are: every number traces to a specific record, the same inputs always produce the same output, bridges reconcile exactly, and every quantified recommendation discloses its assumption. Generated commentary fails all four.
Is Intelligence included in every plan?
Yes. Every paid plan includes the complete Intelligence layer — the briefing, variance and price-volume-mix analysis, revenue attribution by customer, forecasting, KPI dashboards, AR quality scoring, and board packs. Plans differ by client and entity capacity, not by feature. There is no separate Intelligence tier to activate.
Does Intelligence require Fynease Automate?
Yes. Intelligence runs on Automate-transformed data. The reliability of every variance, bridge, and forecast depends on the accrual transformation and audit trail Automate produces. Raw QuickBooks Online data is not a sound foundation for CFO-grade analysis, which is why the two are always sold together.
What is the difference between Intelligence and Valuation?
Intelligence is the monthly reporting layer included in every plan — briefings, variance analysis, forecasting, and board packs. It surfaces transaction-readiness signals such as revenue quality and working capital behaviour on an ongoing basis. Valuation is a per-client add-on at $249 per month for formal work: quality of earnings, EBITDA normalization, DCF, and the working capital peg.
How long does it take to produce a board pack?
Once the close runs in Automate, Intelligence generates the variance analysis, KPI updates, and forecast revisions automatically. The board pack composer assembles them into a formatted package. Most practices report the assembly step dropping from a full day to under two hours, typically the same day the close completes.
32 hours recovered. Two more clients.
Same practice, different math.

Intelligence turns your clean Automate financials into CFO-grade reporting automatically. Your time goes into advising clients — not assembling spreadsheets.

Start free trial
14-day free trial · No credit card
Need Valuation reporting?
Add the Valuation module — $249/client
Questions?
Contact us