| Variance analysis and KPIs | Yes: bridges that reconcile by construction | Yes: actual vs budget, target, prior period | Yes Across every account and transaction; anomaly and fraud detection | Yes Actuals vs budget and forecast, metric targets, AI actuals-vs-budget reports | Yes Budget vs actual, custom metrics with non-financial data, health score, alerts on cash, AR aging, and margin | Yes Budget vs actuals by department with owners and approvals (FinanceIQ); dashboards | Budget vs actual templates; KPI dashboard templates Single-company KPI dashboards; QuickBooks budgets module added September 2026 |
| Forecasting | Yes: three statements over three or five fiscal years, scenarios, 13-week cash | Yes: strong Three-way, up to 5 years beyond the current financial year on Pro, scenarios, rolling, consolidated | Yes: strong Driver-based four-way forecasts to 10 years; 180-day daily cash manager | Yes: strong Three-way budgeting and forecasting, drivers, turnover projections, budgets by class | Yes: Clockwork strength Auto-built five-year three-statement model, plain-English drivers, unlimited scenarios, department budgets, headcount planning | Model it in the sheet Departmental budgets in FinanceIQ; AI-assisted forecasting claimed for Flow | Separate product G-CashFlow: three-way forecasting and scenarios, priced separately from $50/month |
| 13-week cash flow forecast | Yes Weekly grain, AR aging overlay with collection timing, scheduled loan and lease payments, forecast low point shown with its date | Monthly cash flow forecast Three-way, indirect method, up to 5 years on Pro; a weekly 13-week view is not described | Cash Manager 180-day daily cash forecast with AI payment timing; weekly forecasts on Advanced | Monthly cash flow forecast A weekly 13-week view is not described | Yes: 52-week weekly cash forecast Transaction-level, learns collection and payment behavior, editable invoice by invoice | Not described | Not described G-CashFlow forecasts; a weekly 13-week view is not described |
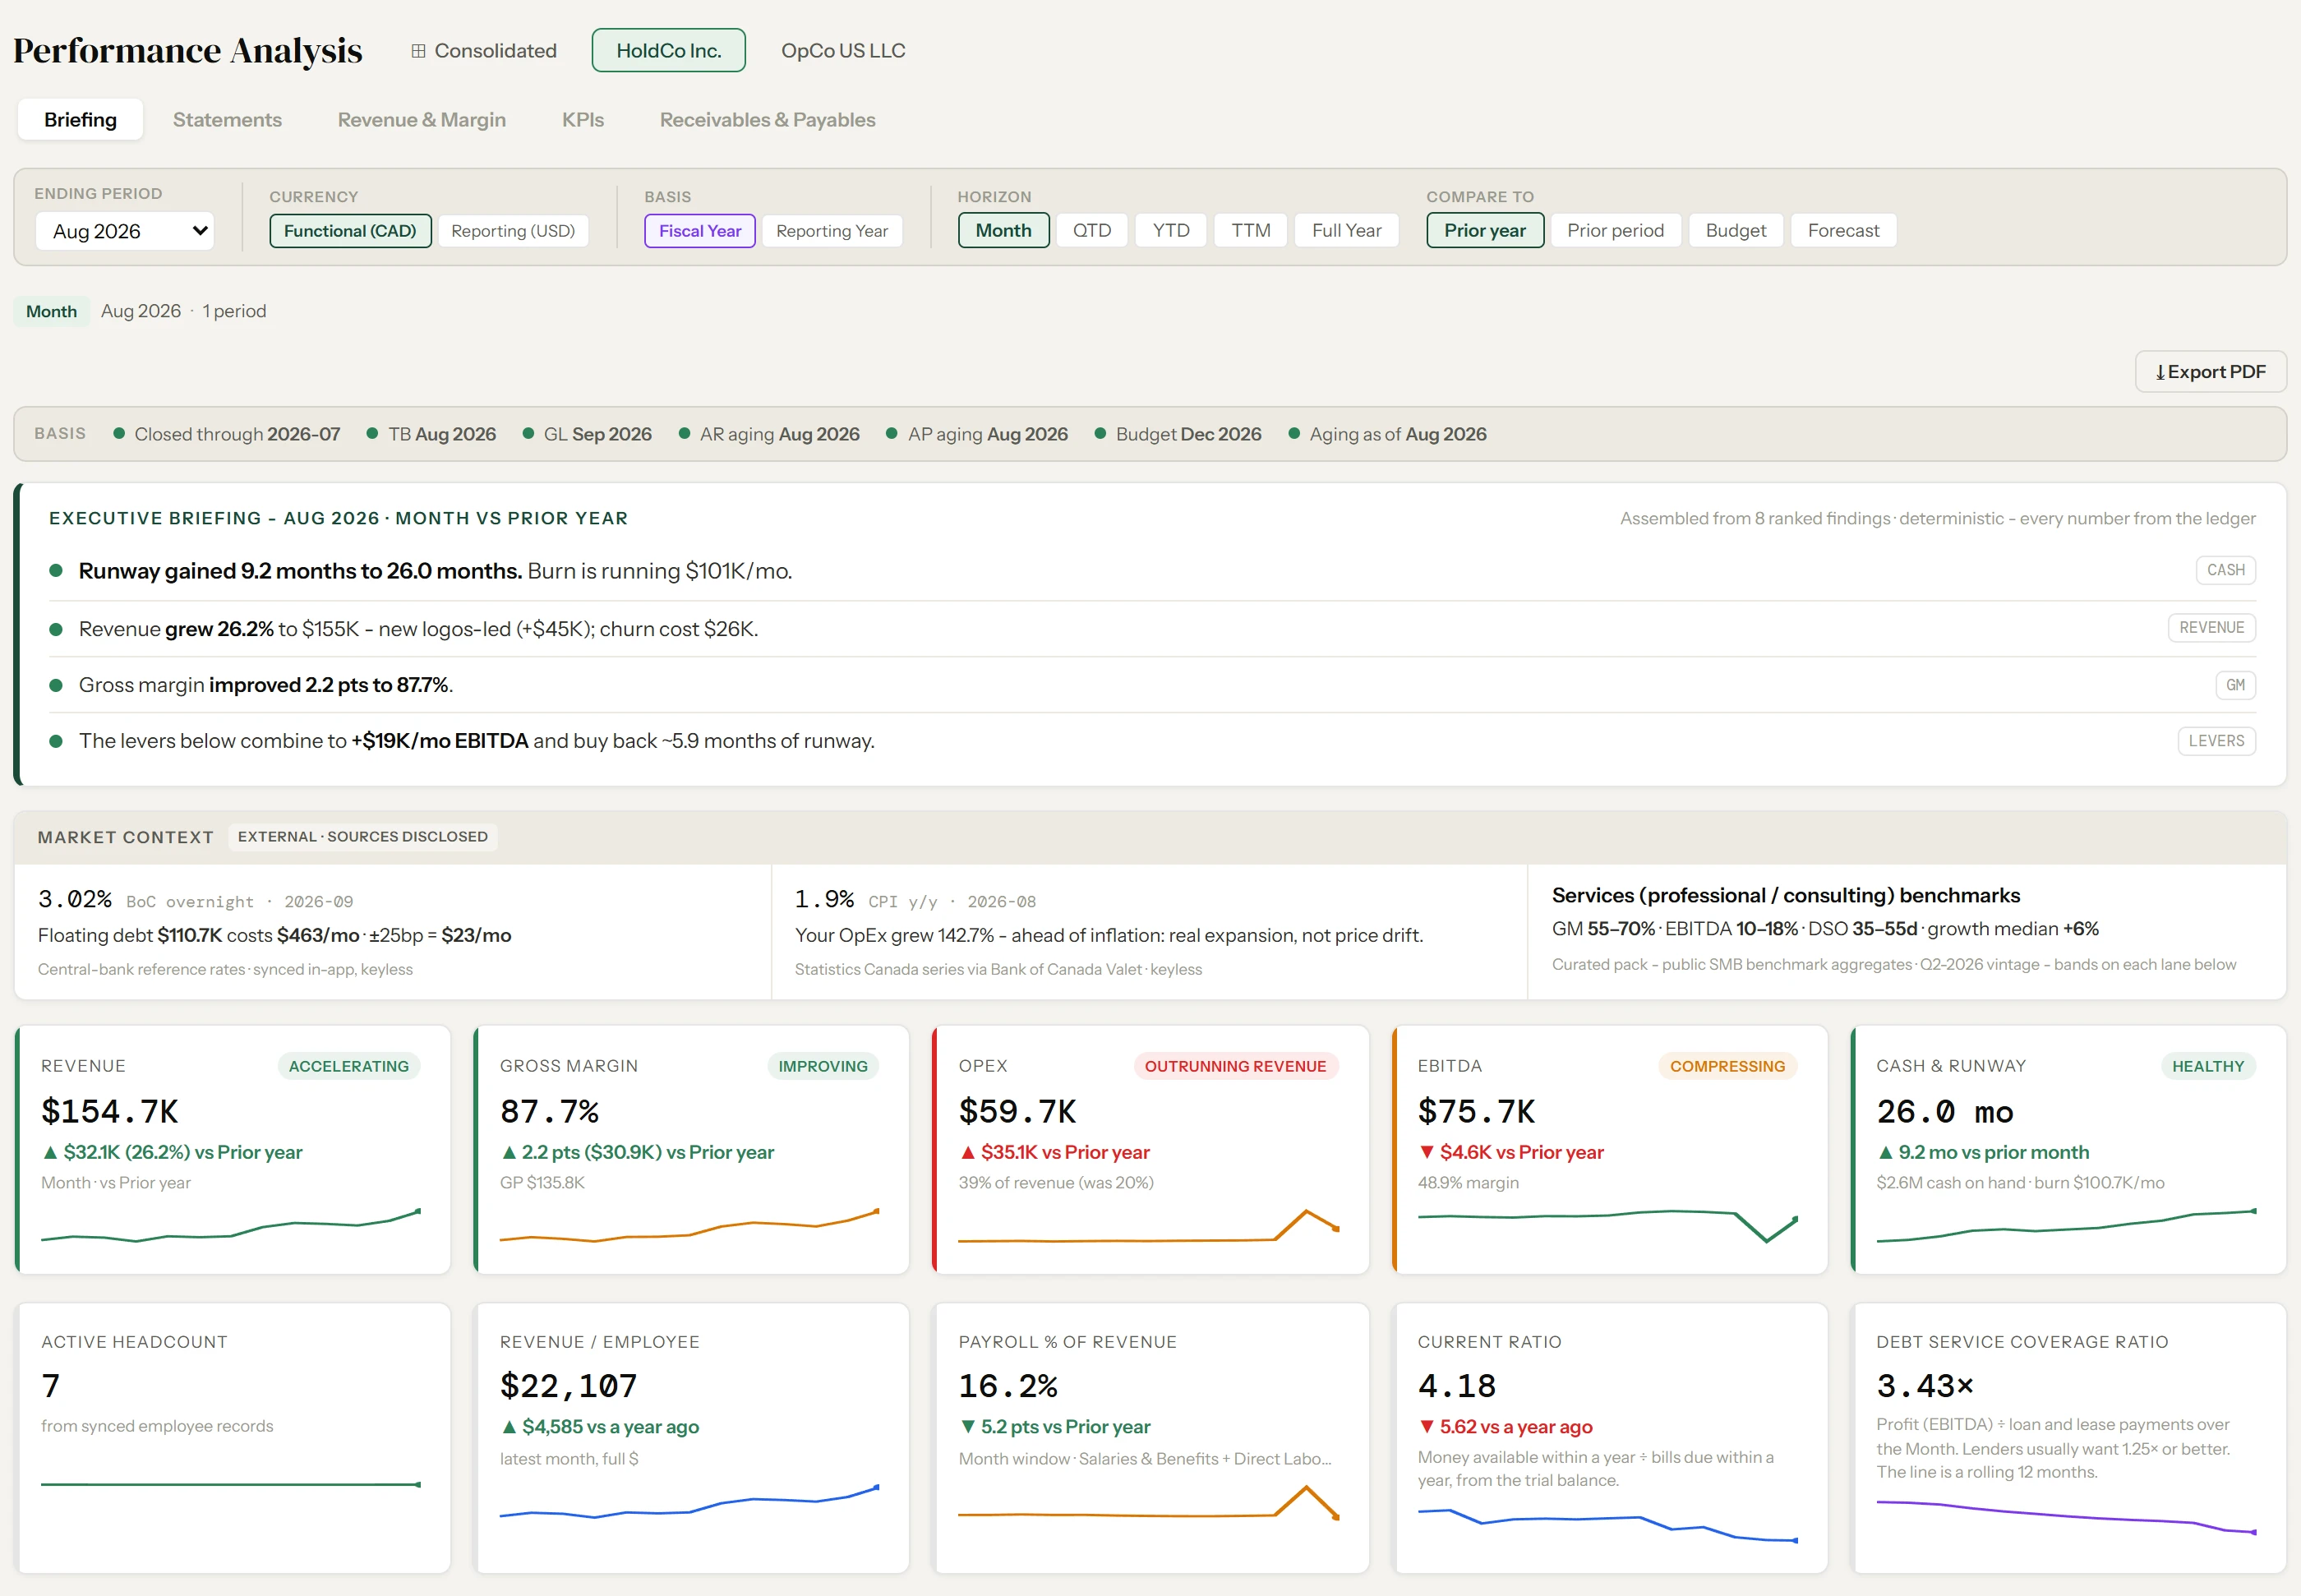
| Management commentary | Deterministic briefing Every sentence derived from the ledger; no language model | AI Commentary Writer Generated commentary on Pro reports; attribution traces figures | Syft Assist AI Insights, summaries, narration, and voice Q&A via third-party language models | AI Enhanced Reporting Short and long analysis via a third-party model; Claude-based dashboard widgets in beta | Mira, agentic AI analyst Answers questions, runs scenarios, drafts variance commentary; underlying model not disclosed | Agent activity in Flow AI agents with human review and logged decisions; model not disclosed; no commentary product described for FP&A | No |
| Board and management report packs | Yes: briefing plus board pack composer | Yes Template library, white-label, scheduled delivery | Yes Templates, Live Views, scheduled delivery to email, Slack, and Teams | Yes Board report templates, PDF export; scheduled email delivery not described | Yes Board-ready packages, PDF export, live shared reports; scheduled delivery not described | Yes Sheets and Excel templates that update automatically; publish live or as a snapshot | Scheduled report delivery Branded templates emailed as PDF, Excel, or Sheets; no pack composer |
| Price-volume-mix analysis | Yes: price, volume, and mix by item and by customer, against the prior year | No Account totals only; no item or customer data | Not described | Not described | Not described | Not described | Not described |
| Quality of revenue scoring | Yes: recurring revenue, concentration, retention, and a quality of revenue score | No | Not described | Not described | Not described | Not described | Not described |
| Customer and product profitability | Yes Contribution margin by customer, product, segment, or business unit every close; revenue and gross margin attribution by customer | Divisional only By class or location (up to 80); no customer or product data imported | Class and tracking-category reporting To two levels; customer and product margin not described | By class, department, or location Customer and product margin not described | Not described | Not described | Sales by customer and product templates Margin by customer or product not described |
| Spreadsheet and BI access | Excel and PDF export | Not compared | Not compared | Not compared | Not compared | Yes: LiveFlow strength Google Sheets and Excel add-ins, live-updating models, board pack templates | Yes: strong Google Sheets native, no row limit; Looker, Tableau, and Google Charts connectivity; Google Sheets only, no Excel add-in |
| Balance Sheet reconciliation and sign-off Whether the books are closed before they are reported | Yes: every account, three-stage sign-off, timestamped | No | No Data review flags unreconciled bank items and anomalies; no sign-off workpapers | No Reach states it does no reconciliation of any form | No | No in FP&A Flow has continuous bank reconciliation and a close checklist | No |
| Multi-entity consolidation | Yes: QuickBooks Online + CSV/Excel entities | Yes: up to 300 entities Across QuickBooks, Xero, MYOB, Sage, and Excel companies | Yes: strong Unlimited entities, proportional and acquisition methods, NCI, goodwill, consolidations of consolidations | Yes No stated entity limit; account matching for same-name accounts | Consolidated forecasting on Ultimate Entities viewed together or separately | Yes: strong Any number of entities, intelligent mapping, non-controlling interest, in Sheets, Excel, or dashboards | Yes Two or more companies, QuickBooks and Xero mixed, account mapping, in Google Sheets |
| Pricing (published) | From $199/month early bird (standard $249); 1 client, 3 entities, Automate and Intelligence included (Valuation is a per-client add-on); 14-day free trial | Fathom Pro from $59/month per company (USD); Portfolio for firms from $67/month for 100 companies; unlimited users; 14-day free trial | Priced per entity per month; unlimited users; consolidations free; 14-day free trial; included with qualifying Xero plans | Per data connection, unlimited users: 1 connection $149/month, 10 connections $290/month, 25 connections $550/month; additional connections $22 to $149; 30-day free trial | Per company, unlimited users: Predict $499/month annual ($629 monthly), Ultimate $1,199 ($1,499) with consolidation; Enterprise from $30,000/year. Firms: Start $799/month for 10 files, Scale $1,999 for 30, Growth $3,999 for 80. 14-day trial for businesses | Not published; priced by number of entities for FP&A and all-inclusive for Flow, by demo. LiveFlow’s own blog has cited a starting point of $500/month; no trial on the live pricing page | Per connector: Business $60/month (3 companies, 1 user), Accountant $150 (25 companies, 5 users), Advisor $300, Enterprise $450; extra company $10; G-CashFlow separate; 14-day free trial |